2.1 Starting with a Big Bang
Planets don’t form in isolation. Planet formation happens as part of the larger process of solar system formation, and solar systems form where enough of the right chemical elements are available. The relative abundance of chemical elements in the universe depends on the processes that make atoms, and that relative abundance is what controls the properties of planets and the stars they orbit.
In other words, Earth’s story begins at the very beginning with the construction of the elements that comprise it.
The Big Bang Was Not a Big Bang
According to the big bang theory, the universe began almost 14 billion years ago (Glaser, 2021 & Choi, 2020) with a rapid expansion of matter, energy, and space.
The phrase “big bang” suggests an explosion. If you imagine an explosion within a room, you might visualize a blast of light with debris flying away from a central location and hitting the walls of the room. That’s the wrong mental image for thinking about the big bang. Instead, you have to imagine that no room existed at the start. The room simply blinks into existence without a lot of drama or flaming debris, and proceeds to get bigger.
Another difference between an explosion and the big bang is that the explosion ends. If you returned to the explosion room a few hours later you might see a small crater in the floor, and some charred rubble scattered around. In contrast, the big bang room would be much larger than when you last checked, and it would continue to expand before your eyes.
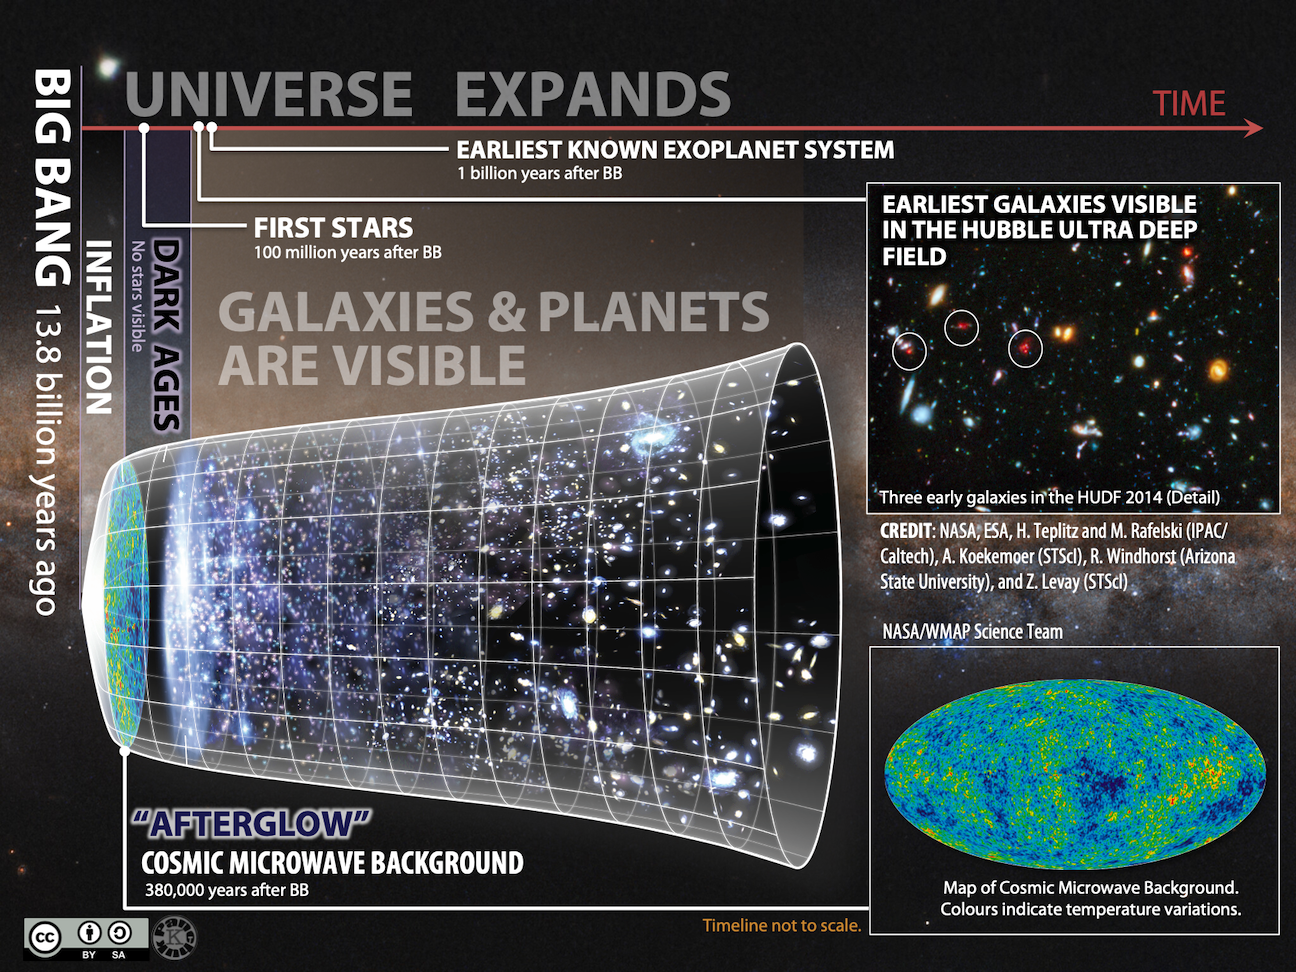
In Figure 2.2 the pointed end of the universe “vessel” represents the big bang. As time advances (moving to the right in the diagram), the vessel gets wider.
You might wonder how a universe can be created out of nothing. Creating a universe out of nothing is mostly beyond the scope of this chapter, but there is a way to think about it. The particles that make up the universe have opposites that cancel each other out, similar to the way that we can add the numbers 1 and -1 to get zero (also known as “nothing”). As far as math goes, having zero is exactly the same as having a 1 and a -1. It is also exactly the same as having a 2 and a -2, a 3 and a -3, two -1s and a 2, and so on. In other words, nothing is really the potential for something if you divide it into its opposite parts.
Big Bang Theory
You might have noticed that we refer to the big bang theory, not the big bang hypothesis. It might be to hard to imagine that we could have any certainty at all about something as fundamental as how the universe started, but there is ample evidence to support the big bang theory. Generally speaking, the universe seems to behave the way predictions based on the big bang theory say it should.
A Baby Picture of the Universe
The notion of seeing the past is often used metaphorically when we talk about ancient events, but in this case it’s meant literally. In our everyday experience, when we watch an event take place, we perceive that we’re seeing it as it unfolds in real time. In fact, this isn’t true. To see the event, light from that event must travel to our eyes. Light travels very rapidly, but not instantly. If we were watching a digital clock 1 m away from us change from 11:59 a.m. to 12:00 p.m., we would actually see it turn to 12:00 p.m. three billionths of a second after it happened.
This isn’t enough of a delay to cause us to be late for lunch, but the universe is a very big place, and the “digital clock” in question is often much, much farther away. In fact, the universe is so big that it’s convenient to describe distances in terms of light years, or the distance light travels in one year. What this means is that light from distant objects takes so long to get to us that we see those objects as they were at some considerable time in the past. For example, the star Proxima Centauri is 4.24 light years from the sun. If you viewed Proxima Centauri from Earth on January 1, 2018, you would actually see it as it appeared in early October 2013.
We now have tools that are powerful enough to look deep into space and see the arrival of light from early in the universe’s history. Astronomers can detect light from approximately 380,000 years after the big bang is thought to have occurred. Physicists tell us that if the big bang happened, then only 380,000 years later, particles within the universe would still be very close together—so close that light wouldn’t be able to travel far without bumping into another particle and getting scattered in another direction. The effect would be to fill the sky with glowing fog, the “afterglow” from the formation of the universe.
In fact, this is exactly what we see when we look at light from 380,000 years after the big bang. (European Space Agency, 2015) The fog is referred to as the cosmic microwave background (or CMB), and it has been carefully mapped throughout the sky. In Figure 2.2, the colourful patch at the narrow end of the universe vessel represents the fog that is measured today as the CMB. The inset CMB map of the universe is a Mollweide projection. This projection is usually used to show Earth’s geography on a flat surface, but in this case it represents spherical space looking toward the sky rather than what’s beneath our feet.
Colour variations in the CMB map represent temperature variations. These variations translate to differences in the density at which matter was distributed in the early universe. The red patches are the highest density regions and the blue patches are the lowest density. Higher density regions represent the eventual beginnings of stars and planets. The CMB map in Figure 2.2 has been likened to a baby picture of the universe.
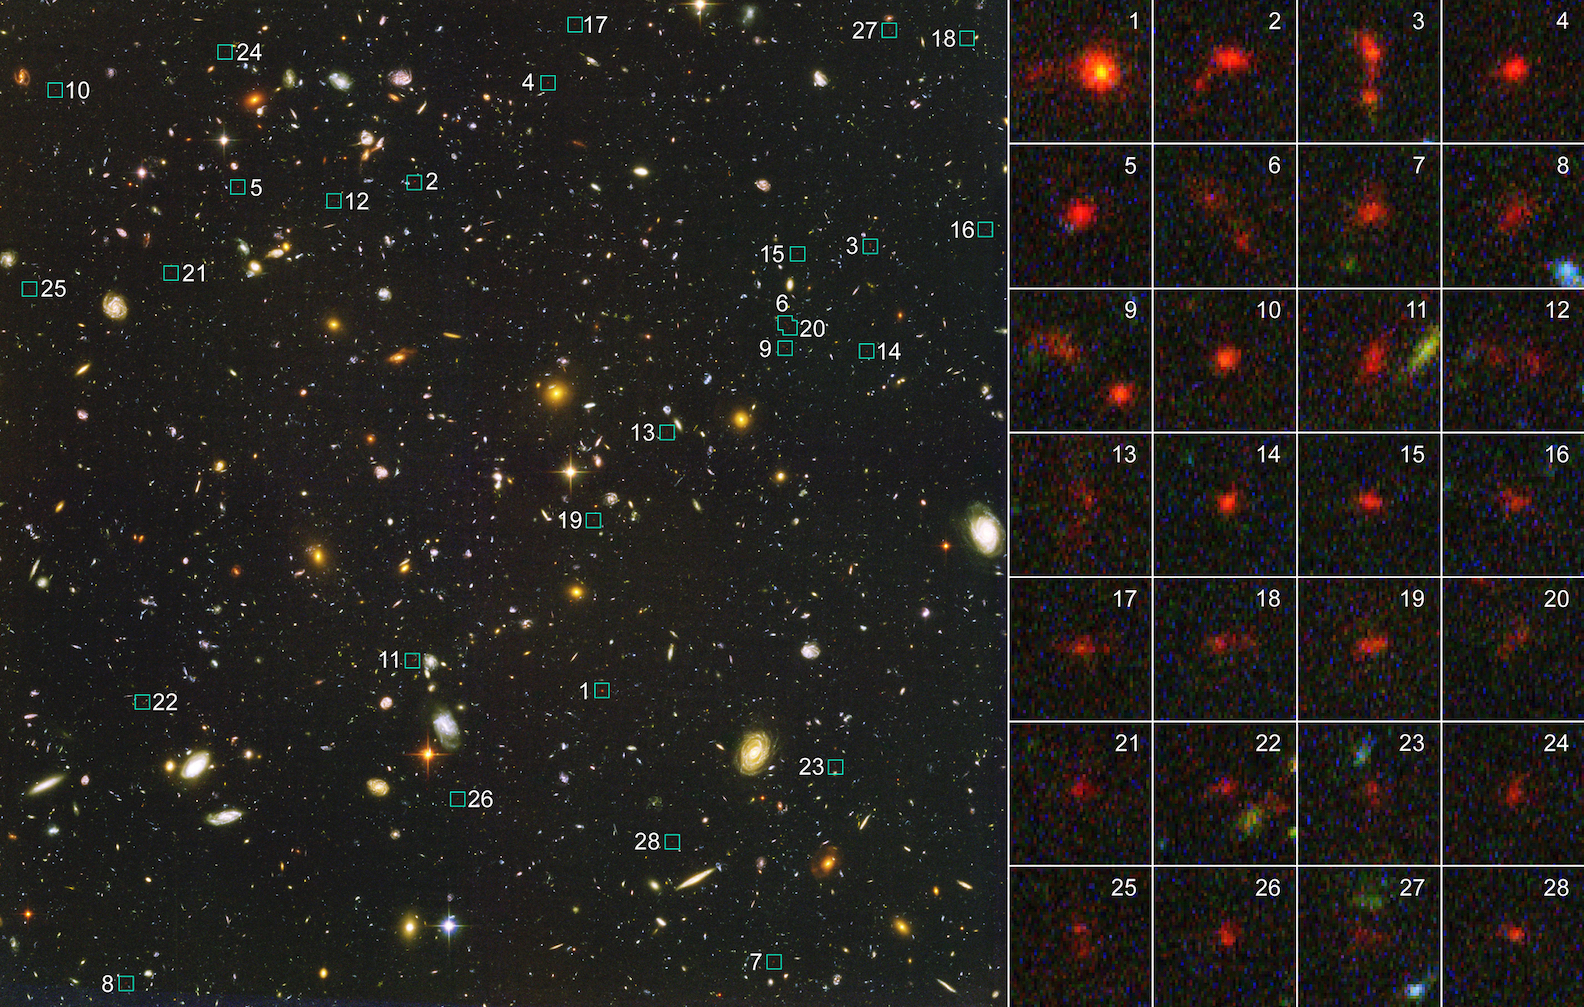
Is this image really showing actual galaxies from when the universe was still young? Choose one:
- Yes, this photo shows objects as they existed billions of years before the photo was taken.
- No, impossible! We can’t literally see into the past. An artist must have created this image.
To check your answer, navigate to the below link to view the interactive version of this activity.
The Universe is Still Expanding
The expansion that started with the big bang never stopped. It continues today, and we can see it happen by observing that large clusters of billions of stars, called galaxies, are moving away from us. (An exception is the Andromeda galaxy with which we are on a collision course.) The astronomer Edwin Hubble came to this conclusion when he observed that the light from other galaxies was red-shifted. The red shift is a consequence of the Doppler effect. This refers to how we see waves when the object that’s creating the waves is moving toward us or away from us.
Before looking at the Doppler effect as it pertains to light, it can be useful to see how it works on something more tangible. The duckling swimming in Figure 2.3 is generating waves as it moves through the water. It’s generating waves in front and behind, but notice that the ripples ahead of the duckling are closer to each other than the ripples behind the duckling. The distance from one ripple to the next is called the wavelength. The wavelength is shorter in the direction that the duckling is moving, and longer as the duckling moves away.
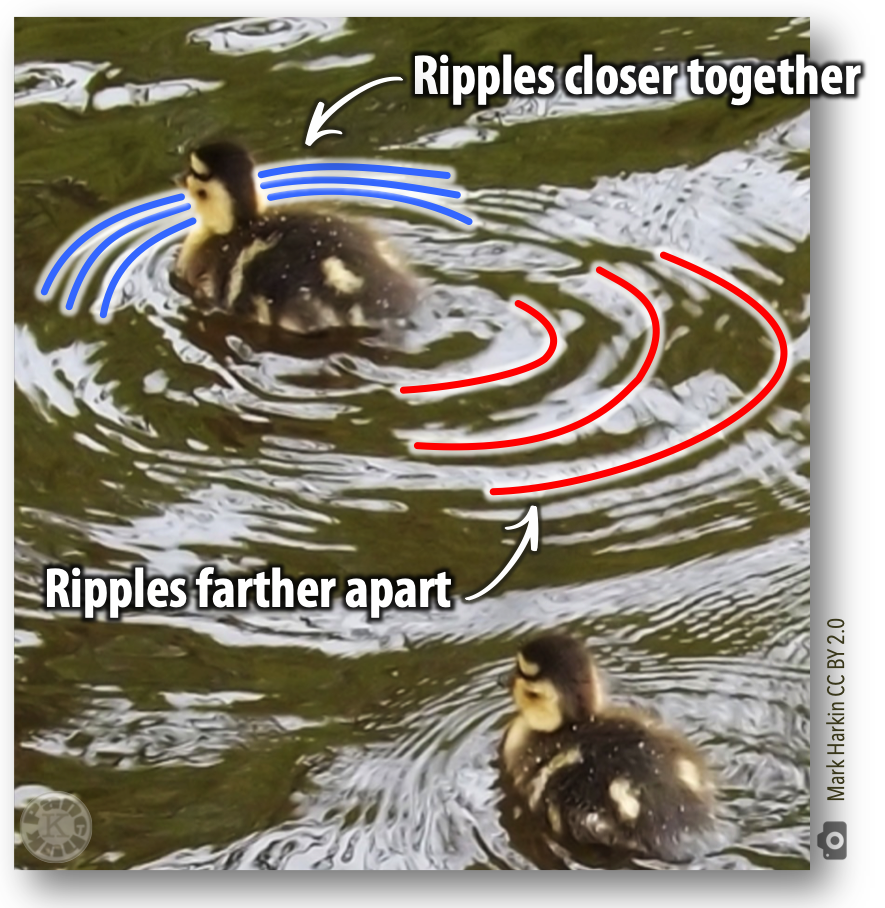
When waves are in air as sound waves rather than in water as ripples, the different wavelengths manifest as sounds with different pitches: the short wavelengths have a higher pitch, and the long wavelengths have a lower pitch. This is why an observer will hear a change in the pitch of a car’s engine or train whistle as the car or train races past.
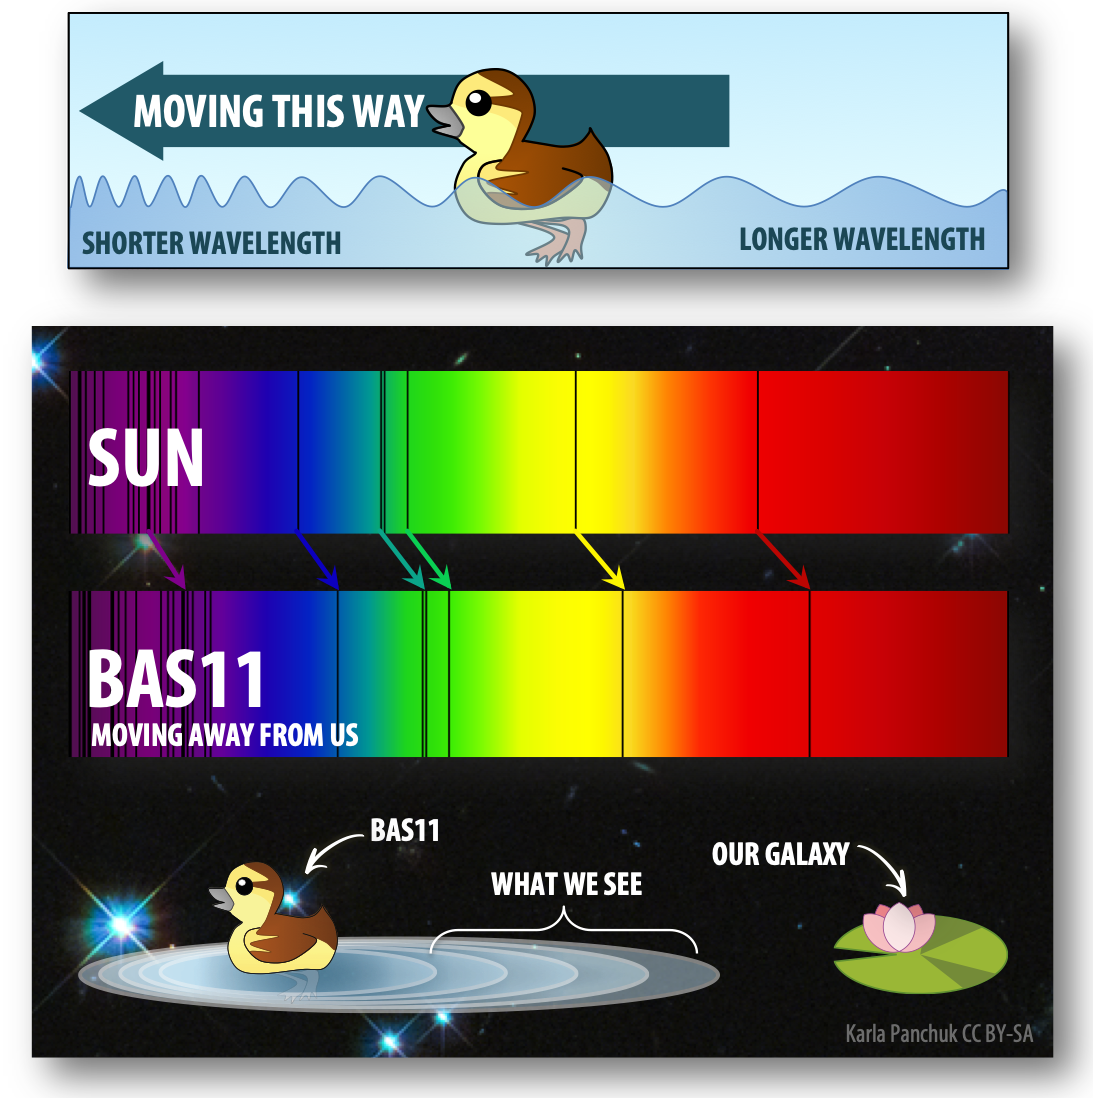
For light waves, wavelength translates to colour. In the spectrum of light that we can see, shorter wavelengths are on the blue end of the spectrum, and longer wavelengths are on the red end of the spectrum. In Figure 2.4, the longer or shorter wavelengths of the water ripples at the top of the diagram are analogous to the longer or shorter wavelengths of light in the visible spectra below.
Does the red shift mean that galaxies look red because they are moving away from us?
Sometimes. The ancient galaxies in the Hubble Ultra Deep Field look red because they are moving away from us so rapidly. For other galaxies, the colour we see is shifted toward the red end of the spectrum and longer wavelengths, but not necessarily actually red.
Notice that the sun’s spectrum in the upper part of Figure 2.4 has black lines in it. The black lines are there because some colours are missing from the sun’s light that reaches Earth. Different elements absorb light of specific wavelengths, and many of the black lines in Figure 2.4 represent colours that are absorbed by hydrogen and helium within the sun. This means the black lines are like a bar code that can tell us what a star is made of.
The lower spectrum in Figure 2.4 is the light coming from BAS11, an enormous cluster of approximately 10,000 galaxies located 1 billion light years away. The black lines represent the same elements as in the sun’s spectrum, but they are shifted to the right toward the red end of the spectrum, because BAS11 is moving away from us as the universe continues to expand. To summarize, because almost all of the galaxies we can see have light that is red-shifted, it means they are all moving away from us. In fact, the farther away they are, the faster they are going. This is evidence that the universe is still expanding.
Composition of the Universe
In Figure 2.2, the “contents” of the vessel change as time progresses. A few minutes after the big bang, the universe was still too hot and dense to be anything but a sizzle of particles smaller than atoms. But as it expanded, it also cooled. Eventually particles that collided were able to stick together to form atoms, rather than being smashed apart again when other particles crashed into them. Those collisions produced hydrogen and helium, the most common elements in the universe.
For a long time after the big bang, clouds of hydrogen and helium atoms drifted about a dark universe. The Dark Ages (bottom of Figure 2.2) were a time when the ingredients for stars existed, but—at first—the stars themselves did not yet exist. The first stars likely appeared within 100 million years of the big bang,4 but the universe remained in the Dark Ages for several 100 million years more because there was too much other material around the stars for their light to be visible from a distance.
How do we know that stars existed during the Dark Ages if we can’t see them?
The timing for the earliest stars comes from computer models that calculate the stage of the universe’s development during which stars could be expected to form (Williams, 2020). In addition, even though astronomers today can’t see visible light from these stars, they can look for other wavelengths of light that the stars emitted.
Do you understand what the red shift means?
References
Choi, S. K. (2020). The Atacama Cosmology Telescope: a measurement of the Cosmic Microwave Background power spectra at 98 and 150 GHz. Journal of Cosmology and Astroparticle Physics, 2020(045). https://doi.org/10.1088/1475-7516/2020/12/045
Glaser, L. B. (2021, January 4). Astronomers agree: Universe is nearly 14 billion years old. Phys.org. https://phys.org/news/2021-01-astronomers-universe-billion-years.html
European Space Agency. (2015, February 5). Planck reveals first stars were born late. http://www.esa.int/Our_Activities/Space_Science/Planck/Planck_reveals_first_stars_were_born_late
