10.5 Metamorphic Facies and Index Minerals
Metamorphic Facies
In any given metamorphic setting there can be a variety of protolith types exposed to metamorphism. While these rocks will be exposed to the same range of pressure and temperatures conditions within that setting, the metamorphic rock that results will depend on the protolith. A convenient way to indicate the range of possible metamorphic rocks in a particular setting is to group those possibilities into metamorphic facies. In other words, a given metamorphic facies groups together metamorphic rocks that form under the same pressure and temperature conditions, but which have different protoliths.
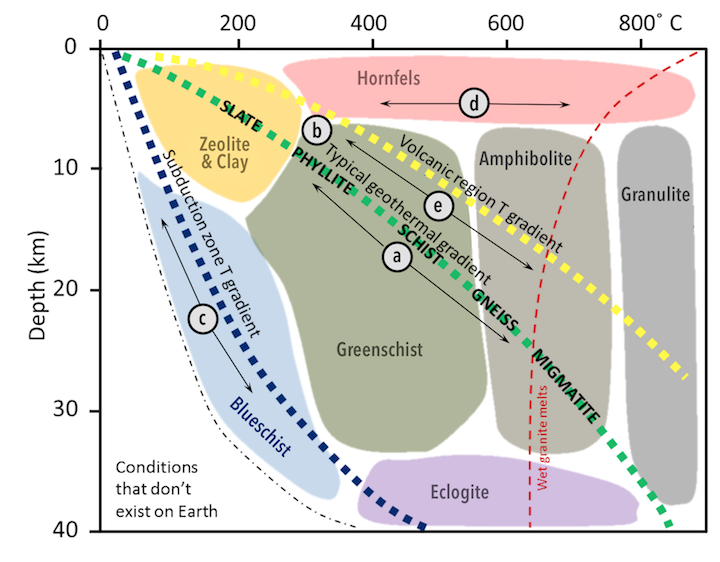
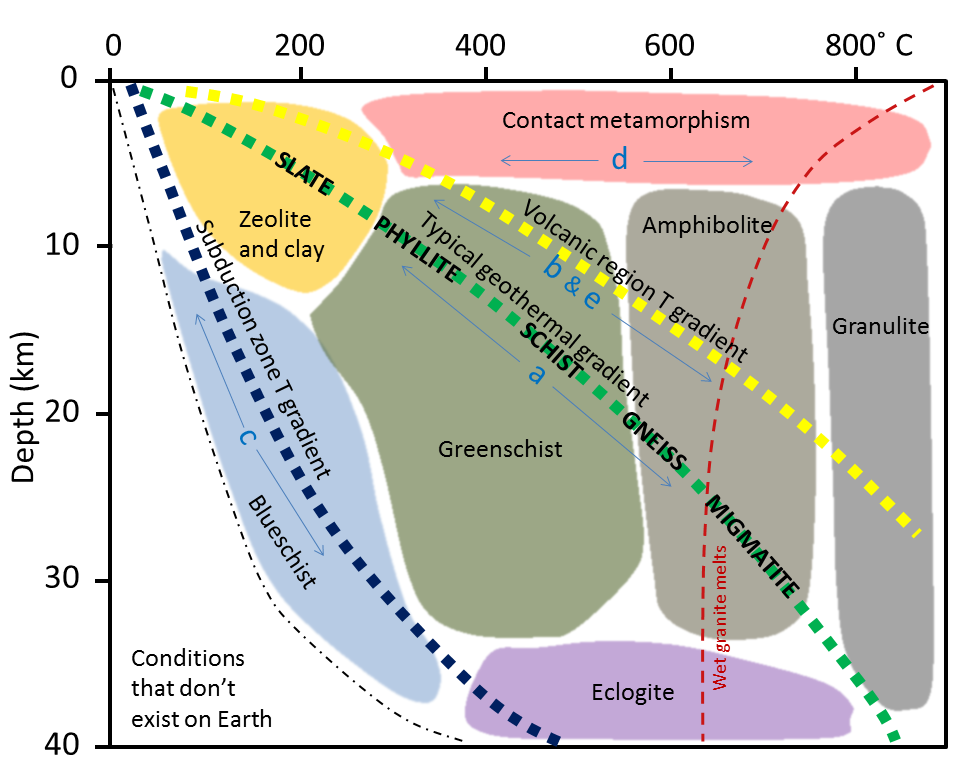
Figure 10.34 shows the different metamorphic facies as patches of different colours. The axes on the diagram are temperature and depth; the depth within the Earth will determine how much pressure a rock is under, so the vertical depth axis is also a pressure axis. Each patch of colour represents a range of temperature and pressure conditions where particular types of metamorphic rocks will form. Metamorphic facies are named for rocks that form under specific conditions (e.g., eclogite facies, amphibolite facies etc.), but those names don’t mean that the facies is limited to that one rock type.
Concept Check: Metamorphic Facies
Fill in the missing words to complete the summary.
Metamorphic group together metamorphic rocks that form under (hint: the same or different?) pressure and temperature conditions, but which have (hint: the same or different?) parent rocks.
The groups are named for a single metamorphic rock that forms under those specific conditions. They can include (hint: Many or no?) other metamorphic rocks.
To check your answers, navigate to the below link to view the interactive version of this activity.
Another feature to notice in the diagram are the many dashed lines. The yellow, green, and blue dashed lines represent the geothermal gradients in different environments. Recall that the geothermal gradient describes how rapidly the temperature increases with depth in Earth. In most areas (green dashed line), the rate of increase in temperature with depth is 30 °C/km. In other words, if you go 1,000 m down into a mine, the temperature will be roughly 30 °C warmer than the average temperature at the surface. In volcanic areas (yellow dashed line), the geothermal gradient is more like 40 to 50 °C/km, so the temperature increases much faster as you go down. Along subduction zones (blue dashed line), the cold ocean lithosphere keeps temperatures low, so the gradient is typically less than 10 °C/km.
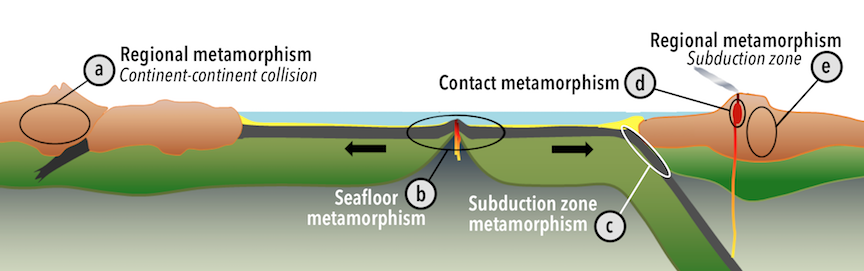
The yellow, green, and blue dashed lines in Figure 10.34 tell you what metamorphic facies you will encounter for rocks from a given depth in that particular environment. A depth of 15 km in a volcanic region falls in the amphibolite facies. Under more typical conditions, this is the greenschist facies, and in a subduction zone it is the blueschist facies. You can make the connection more directly between the metamorphic facies and the types of metamorphism discussed in the previous section by matching up the letters a through e in Figure 10.34 with the labels in Figure 10.35.
One other line to notice in Figure 10.34 is the red dashed line on the right-hand side of the figure. This line represents temperatures and pressures where granite will begin to melt if water is present. Migmatite is to the right of the line because it forms when some of the minerals in a metamorphic rock begin to melt, and then cool and crystallize again.
Practice with Metamorphic Facies and Geothermal Gradients
Note: It’s okay to peek at the metamorphic facies diagram (Figure 10.34) if you need to.
Match the words into the correct boxes.
The geothermal gradient is in subduction zones, because temperatures are at depth than in other locations. Most subduction zone conditions fall within the facies, named for a uniquely coloured foliated rock.
The geothermal gradient is in volcanic regions because temperatures get at shallower depths than in other locations. At the highest pressures and temperatures, the volcanic region geothermal gradient falls within the facies.
Contact metamorphism falls within relatively pressure conditions in the facies. This is because as you go deeper, temperatures get too for there to be a big contrast between magma and other rocks.
Fill-in-the-blank options:
- hornfels
- shallowest
- low
- steepest
- hotter
- blueschist
- high
- cooler
- granulite
To check your answers, navigate to the below link to view the interactive version of this activity.
Index Minerals
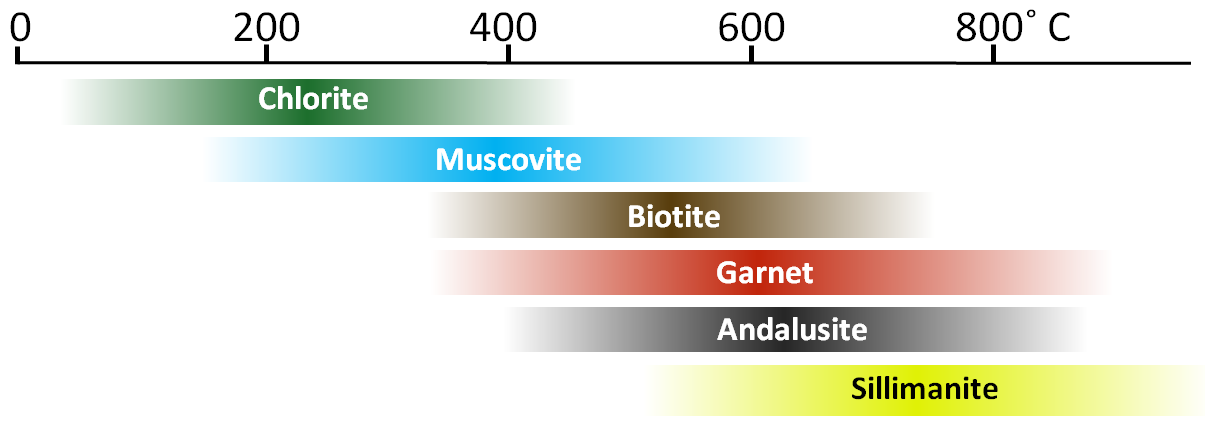
Some common minerals in metamorphic rocks are shown in Figure 10.36, arranged in order of the temperature ranges where they tend to be stable. The upper and lower limits of the ranges are intentionally vague because these limits depend on a number of different factors, such as the pressure, the amount of water present, and the overall composition of the rock.

Even though the limits of the stability ranges are vague, the stability range of each mineral is still small enough that the minerals can be used as markers for those metamorphic conditions. Minerals that make good markers of specific ranges of metamorphic conditions are called index minerals.
The Meguma Terrane of Nova Scotia: An Example of How Index Minerals Are Used
The southern and southwestern parts of Nova Scotia were regionally metamorphosed during the Devonian Acadian Orogeny (around 400 Ma), when a relatively small continental block—the Meguma Terrane (Figure 10.37 top )—collided with the existing eastern margin of North America. The clastic sedimentary rocks within this terrane were variably metamorphosed.
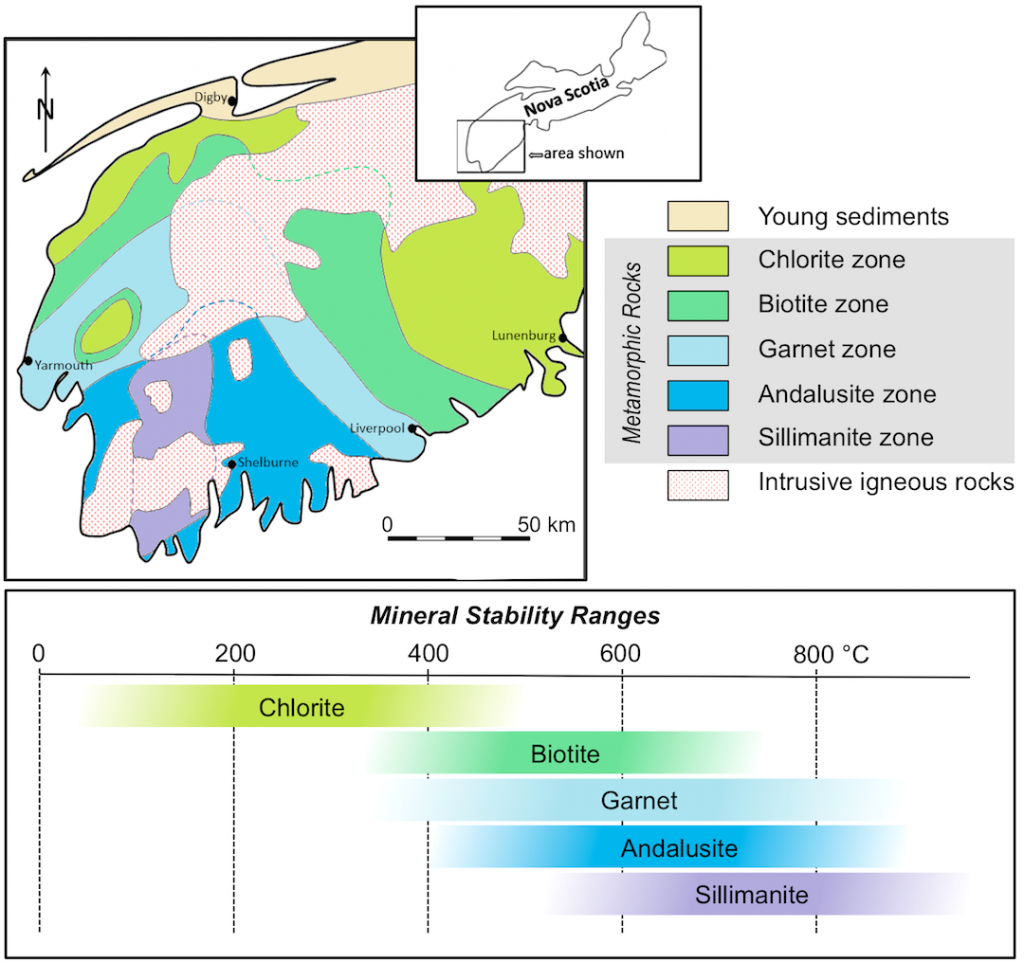
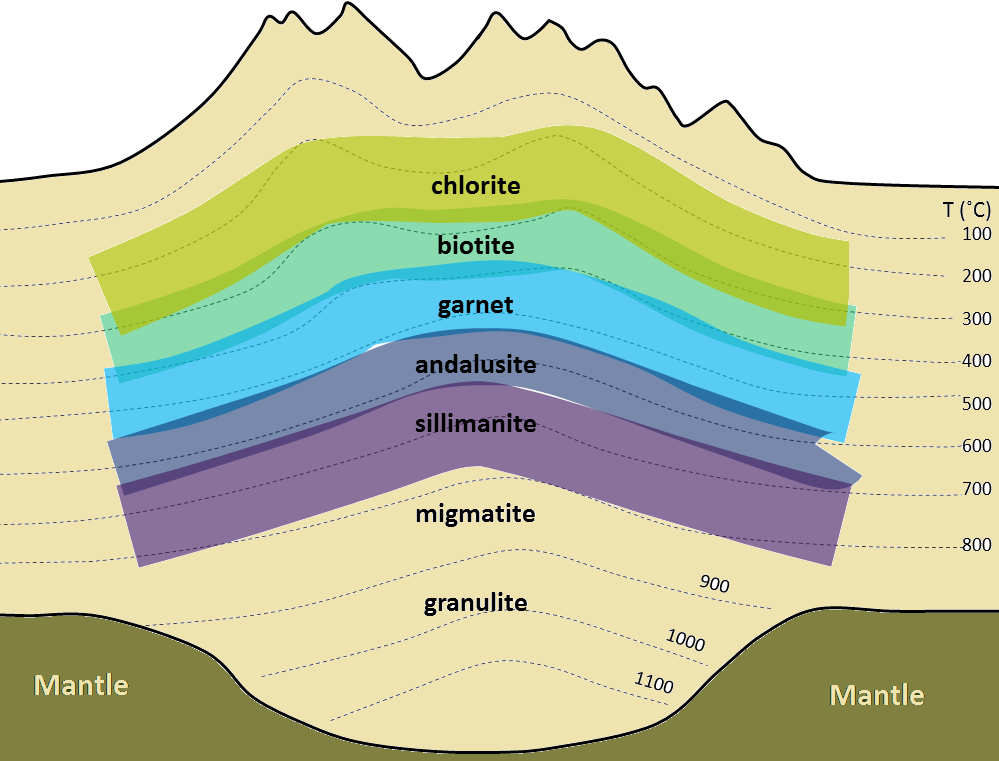
Index minerals have been used to map areas of higher or lower metamorphic intensity, called metamorphic zones. A metamorphic zone is a region bounded by the first appearance of one index mineral and the first appearance of the next. In the Meguma Terrane, the biotite zone (darker green) begins in the east and north with the first appearance of biotite. The biotite zone ends toward the south and west where garnet first appears. Because index minerals can have overlapping stability conditions, a lower-intensity index mineral can still be present in a higher-intensity metamorphic zone.
Knowledge of metamorphic zones makes it possible to draw conclusions about the geological conditions in which metamorphic rocks formed. The highest-intensity metamorphism (highest metamorphic grade)—the sillimanite zone—is in the southwest. Progressively lower grades of metamorphism exist toward the east and north. The rocks of the sillimanite zone were likely heated to over 700 °C, and therefore must have been buried to depths between 20 km and 25 km. The surrounding lower-grade rocks were not buried as deeply, and the rocks within the peripheral chlorite zone were likely not buried to more than about 5 km depth.
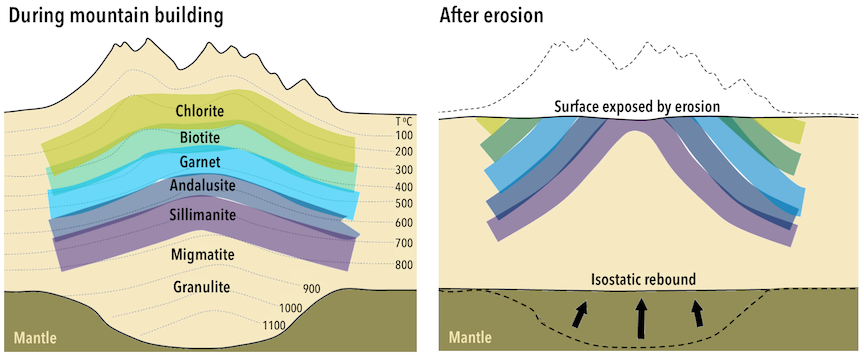
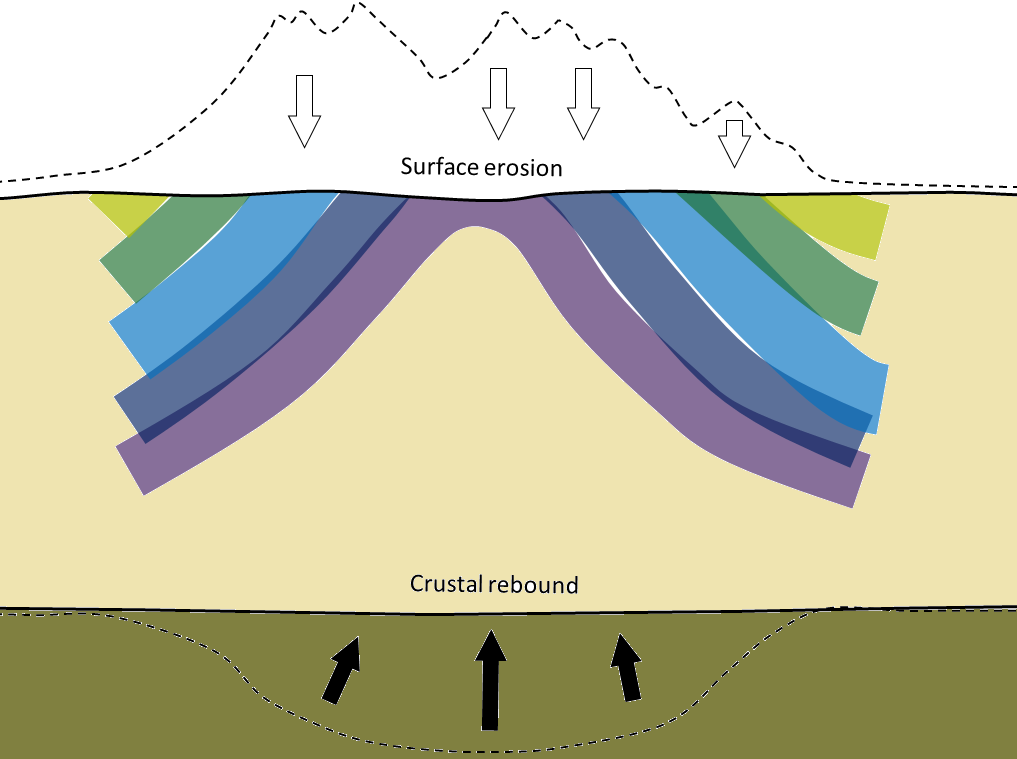
A probable explanation for this pattern is that the area with the highest-grade rocks was buried beneath the central part of a mountain range formed by the collision of the Meguma Terrane with North America. The collision caused rocks to be folded, and to be faulted and stacked on top of each other. These mountain-building processes thickened Earth’s crust, and increased its mass locally as the mountains grew. The increased mass of the growing mountains caused the lithosphere to float lower in the mantle (Figure 10.38, left). As the mountains were eventually eroded over tens of millions of years, the crust floated higher and higher in the mantle, and erosion exposed metamorphic rocks that were deep within the mountains (Figure 10.38, right).
Building a narrative for the metamorphism in Nova Scotia’s Meguma Terrane is just one example of how index minerals can be used.
Try It Yourself: Meguma Terrane Index Minerals
References
Keppie, D., & Muecke, G. (1979). Metamorphic map of Nova Scotia. (Nova Scotia Department of Mines and Energy, Map 1979-006).
White, C. E., & Barr, S. M. (2012) Meguma terrane revisited: Stratigraphy, metamorphism, paleontology and provenance. Geoscience Canada, 39(1). https://journals.lib.unb.ca/index.php/GC/article/view/19450/21005
